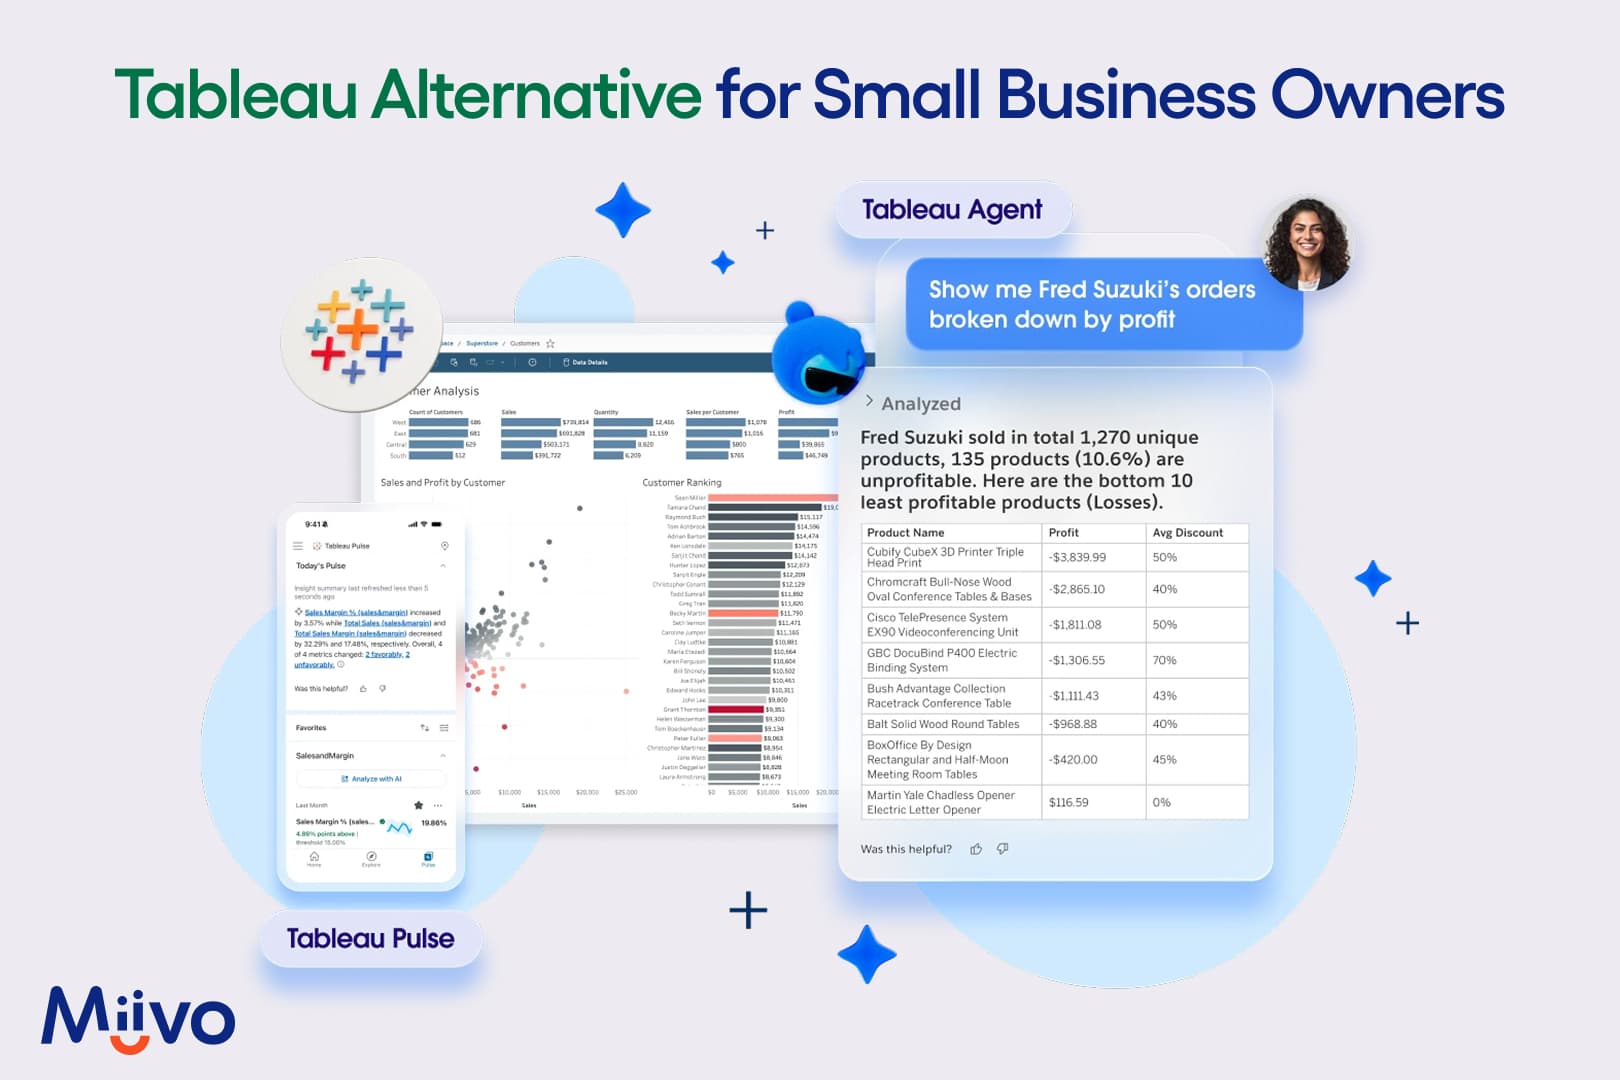
Tableau is one of the most recognized data visualization platforms in the world. The software was founded in 2003, acquired by Salesforce in 2019, and now has over a million users globally. It is also one of the most expensive. A Creator licence, the tier you need to build dashboards, costs $75 per user per month on the Standard plan, billed annually. For a team of three Creators, that is $2,700 per year in licences alone, before training, data preparation, or hosting costs.
Tableau is genuinely excellent for enterprise data teams with a data engineer and a Microsoft or Salesforce environment. For many small business owners, three problems arise. First, the licensing costs are difficult to justify when the business does not have a dedicated analytics team to use them. Second, Tableau requires significant time and expertise to set up, as teams report spending 60-80% of their time preparing data before any dashboard can be built. Third, Tableau has no native integration with POS systems or booking platforms, which means physical businesses must export data manually before Tableau can see it.
This page compares 10 alternatives: Miivo, Power BI, Zoho Analytics, Looker Studio, Metabase, Qlik Sense, Domo, DashboardFox, Looker (paid), and Sisense across pricing, technical requirements, and fit for a small business without a data team. The Tableau alternatives cover different needs, such as self-serve BI, free tools, affordable platforms, and scaling options.
TL;DR, Here Is What All 10 Alternatives Cover
A quick overview of 10 best Tableau alternatives before the full review of each is given in the table below.
| Tool | Type | Technical Setup | Physical Biz Data | Best For | Entry Price |
| Miivo | BI service, done for you | No (team handles it) | Yes (POS, booking, reviews) | Physical small businesses | Free / $399/mo |
| Power BI | Self-serve BI | Yes (DAX required) | No | Microsoft 365 users | $14/user/mo |
| Zoho Analytics | Self-serve BI | Moderate | No | SMBs, Zoho users | Free / $30/mo |
| Looker Studio | Dashboarding | Low | No | Google Workspace users | Free |
| Metabase | Self-serve BI | Low-moderate | No | Startups, non-technical teams | Free / $100/mo |
| Qlik Sense | Enterprise BI | High | No | Mid-market, complex data | $300/mo |
| Domo | All-in-one BI | High | No | SaaS, marketing teams | Custom, From ~$2,500/mo+ |
| DashboardFox | Self-serve BI | Moderate | No | Small teams, agencies | $99/mo (5 MAU) |
| Looker (paid) | Enterprise BI | High (SQL/LookML) | No | Google Cloud, BigQuery users | Custom, From ~$60,000/yr |
| Sisense | Embedded analytics | High | No | SaaS companies, enterprise | Custom, From ~$25,000/yr |
Miivo: Physical Business Intelligence, Done for You
What Miivo Is
Miivo is an AI-powered business intelligence service with a dedicated human team behind it. The Tableau alternative connects your POS, accounting software, and review platforms automatically to provide a live daily dashboard that shows your financial and operational picture without requiring you to build or maintain anything yourself. Setup is handled completely by the Miivo team, and the platform goes live within five business days.
Best For
Physical small business owners, like those running restaurants, salons, gyms, and retail stores, who need accurate financial and operational data without hiring a data engineer or learning a BI platform.
What Miivo Does Well
- Miivo connects POS systems, accounting software, and review platforms automatically.
- AI Warning Signals flag problems before they compound.
- Opportunity Cards surface specific actions you can act on the same day.
- A dedicated human team handles all setup and interpretation.
- Most businesses are live within 5 business days.
What Miivo Does Not Do
- Not a data visualization platform in the Tableau sense.
- Does not build custom charts or complex multi-source visualizations on demand.
- Not ideal for digital businesses, SaaS companies, or businesses with internal data teams.
Pricing: Free Ready to Use plan, Built for You at $399/month. Managed Services at $1,299/month. Setup included. No annual contract.
See how Miivo works for physical businesses
Microsoft Power BI: The Most Common Tableau Alternative for Microsoft Users
What Power BI Is
Power BI is a cloud-based BI and analytics platform from Microsoft. The tool integrates with Microsoft 365, Azure, Excel, and Teams, and offers three tiers: Desktop (free, no sharing), Pro, and Premium Per User. It is the most frequently recommended Tableau alternative and the most practical one for Microsoft-stack organizations.
Best For
Small and mid-sized businesses already using Microsoft 365 or Azure who want BI at a lower price than Tableau, with a familiar Microsoft interface. If your team lives in Excel, Power BI is the shortest path to shared dashboards.
What Power BI Does Well
- Pro at $14/user/month is significantly cheaper than Tableau Creator at $75.
- Deep Microsoft integration means your existing data connections often carry over.
- Power BI offers 300+ data connectors, strong visualization options familiar to Excel users, and AI-powered Copilot on Premium plans.
- The user community is large, and free learning resources are widely available.
What Power BI Does Not Do
- Requires DAX (Data Analysis Expression) knowledge for custom calculations and data modeling, which is a real barrier for non-technical users.
- The Desktop authoring tool is Windows-only.
- No native POS or physical business integration.
- Copilot requires a Premium Per User license at $24/user/month, not the base Pro plan.
- Building and maintaining dashboards still requires engineering time, which is a hidden cost small teams often underestimate.
Pricing: Desktop free (cannot share reports). Pro $14/user/month. Premium Per User $24/user/month.
Zoho Analytics: Affordable Self-Serve BI for Small Businesses
What Zoho Analytics Is
Zoho Analytics is a self-service BI and reporting platform built for small and mid-sized businesses. It offers drag-and-drop dashboard creation, AI-powered natural language queries through its Zia assistant, and over 500 integrations with third-party apps and databases.
Best For
Small businesses comfortable building their own reports and wanting an affordable self-serve BI platform. It is a particularly good fit for businesses already using Zoho CRM or other products in the Zoho ecosystem.
What Zoho Analytics Does Well
- Zoho Analytics includes a free plan that covers small teams and pilots.
- The integration library of 500+ connectors is one of the widest available at this price point.
- The drag-and-drop interface is accessible without technical expertise.
- Zia AI assistant answers plain-language data questions and returns charts automatically.
- Pricing is predictable and scales gradually.
What Zoho Analytics Does Not Do
- Fully self-serve, so the owner builds and maintains all dashboards.
- There is no human team for setup or interpretation.
- Does not connect natively to POS systems or booking platforms for physical businesses.
- Performance can drop with datasets above 10 million rows.
- Automated alerts require configuration before they work.
Pricing: Free plan (2 users, 10,000 rows). Basic $30/month. Standard $60/month. Premium $145/month. Enterprise $575/month. Discounts on annual billing.
Google Looker Studio: A Free Reporting Layer for Google Workspace Users
What Looker Studio Is
Google Looker Studio (now Google Data Studio) is Google’s free dashboarding tool. The reporting interface connects natively to Google Analytics 4, Google Ads, Search Console, Google Sheets, and BigQuery, with 800+ community connectors for non-Google data sources. It is a reporting layer, not a full BI platform.
Best For
Businesses that want a free reporting layer over Google Analytics, Google Ads, or other Google Workspace data. It is the fastest starting point for businesses whose data is already in Google’s ecosystem.
What Looker Studio Does Well
- The core product is completely free.
- Provides unlimited dashboards and reports.
- Sharing is simple, as anyone with a link can view a published report.
- Setup is fast enough that non-technical teams can publish a working dashboard within hours of connecting a data source.
What Looker Studio Does Not Do
- Looker Studio is not a full BI platform.
- Has no data warehouse, no semantic layer, and no built in automated alerts.
- Per user cost for viewers dashboards access.
- Connecting to POS or accounting data requires custom community connectors, which carry their own costs.
- Not built for physical business operational data and offers limited governance compared to paid BI tools.
Pricing: Free for core product. Looker Studio Pro $9/user/month (adds governance features and other add-ons for additional cost). Community connectors’ pricing varies by provider. Enterprise annual plans require contact with sales.
Metabase: Simple, Open-Source BI for Non-Technical Teams
What Metabase Is
Metabase is an open-source BI tool designed for non-technical users. The software can be self-hosted for free or deployed via a managed cloud version. Its visual query builder allows business users to answer basic data questions without writing SQL, while a built-in SQL editor gives technical users the flexibility they need.
Best For
Small businesses and startups that want a simple, accessible BI tool without paying Tableau prices. It is best suited to teams with someone comfortable with basic setup and self-hosting, or for teams that want a no-SQL query interface to explore structured data quickly.
What Metabase Does Well
- Self-hosted Metabase is free with no functional limits on the open-source edition.
- The visual query builder makes data exploration accessible to non-analysts.
- The interface is clean and modern, and non-technical teams typically adopt it quickly.
- Supports 20+ data sources and includes automated reports and dashboards.
- Community support is active and well-documented.
What Metabase Does Not Do
- Self-hosting requires server setup and ongoing maintenance.
- Governance and security features are limited compared to Tableau or Power BI, with row-level permissions and SSO locked to Pro and Enterprise tiers.
- Metabase is outgrown quickly by teams with complex analytics needs.
- There is no native POS or physical business integration and no done-for-you service.
Pricing: Open source: free (self-hosted, requires server). Cloud Starter $100/month. Cloud Pro $575/month.
Qlik Sense: Enterprise-Grade Associative Analytics
What Qlik Sense Is
Qlik Sense is an enterprise BI platform built around an associative analytics engine. Instead of limiting users to predefined drill paths, the analytics tool surfaces relationships across all data simultaneously, including unselected values, making it well-suited for exploratory analysis across large, interconnected datasets.
Best For
Mid-market and enterprise organizations with complex, multi-source data environments that want deeper exploration than Tableau’s filter-based approach allows. Finance and retail teams with heavily connected datasets use Qlik.
What Qlik Sense Does Well
- The associative engine finds relationships in data that a linear query would miss.
- Qlik’s in-memory processing delivers fast query performance on large datasets.
- Active Smart Analytics provides AI-powered insight generation.
- Supports cloud, on-premise, and hybrid deployment.
- Integration with Python and R allows advanced analytics outputs to appear directly in dashboards.
What Qlik Sense Does Not Do
- More expensive than Tableau at $300/month and add-ons.
- The learning curve is steeper than most self-serve tools.
- Non-technical users find it difficult to adopt without support.
- Not built for physical business data, has no native POS integration, and its enterprise focus makes it unsuitable for most small businesses without an analytics team.
Pricing: 2 pricing categories for data integration and analytics. Qlik Cloud Analytics plans include Starter from $300/month, Standard from $825/month, Premium from $2,750/month, and Entrprise for a custom quote. Qlik Talend Cloud for data integration includes Starter, Standard, Premium, and Enterprise plans, each at custom pricing.
Domo: All-in-One BI With Unpredictable Consumption Pricing
What Domo Is
Domo is an all-in-one cloud BI platform that combines data integration, transformation, visualization, and app building in a single managed service. The platform offers 1,000+ pre-built connectors and a visual ETL (Extract, Transform, and Load) tool called Magic ETL. It is designed for teams that want a fully hosted BI environment without building a separate data stack.
Best For
Medium to large organizations that want data integration and BI in one platform without managing separate ETL tools. The BI performs well for marketing and operations teams pulling from many SaaS sources simultaneously.
What Domo Does Well
- The connector library of 1,000+ integrations is one of the largest available.
- Magic ETL handles data preparation through a visual interface without requiring SQL.
- Dashboards can refresh in near-real time, and built-in alerts notify teams when metrics cross defined thresholds.
- The mobile experience is strong for executive dashboard consumption.
What Domo Does Not Do
- Domo uses a consumption-based credit pricing model, and users consistently report costs that increase significantly at renewal.
- Small teams report spending $2,000 to $4,000 per month, well above what most small businesses budget for BI.
- Advanced ETL workflows require training.
- Domo has no native POS integration for physical businesses, and the pricing model makes total cost difficult to predict before deployment.
Pricing: Not publicly listed. For small teams, approximately $2,000 to $4,000/month based on user reports. For mid-sized businesses, average $50,000/year reported.
DashboardFox: Monthly Active User Pricing Instead of Per-Seat
What DashboardFox Is
DashboardFox is a self-serve BI platform with an MAU (Monthly Active Users) pricing model rather than a per-seat model. White-label branding and row-level security are included on every plan. The BI tool is positioned specifically as a Tableau alternative for smaller teams and agencies where per-seat pricing creates unnecessary cost for infrequent users.
Best For
Small businesses and agencies that want predictable BI pricing. The MAU model means idle user accounts and report recipients who only receive emails do not count toward the monthly limit, which makes it cost-efficient for mixed usage patterns.
What DashboardFox Does Well
- Businesses only pay for users who actively log in that month.
- White-label branding is available on all plans, not as an add-on.
- Row-level security (Data Tags) is built in without requiring a separate tier upgrade.
- The pricing structure is transparent and stable, unlike consumption-based alternatives.
What DashboardFox Does Not Do
- Visualization depth is less than Tableau.
- The integration library is narrower than Tableau or Power BI.
- There is no native POS integration for physical businesses.
- Setup is self-serve with no done-for-you option.
- Businesses with heavy custom reporting needs will find its chart options limited.
Pricing: Starter $99/month (5 MAU). Growth $249/month (30 MAU). Scale $499/month (100 MAU). Custom pricing for Enterprise. Discounts available.
Looker (Google Paid): Enterprise BI for SQL Teams on Google Cloud
What Looker Is
Looker is a paid enterprise BI platform acquired by Google, different from the free Looker Studio product. The BI tool is built around LookML, a SQL-based semantic modeling layer that defines metrics once and enforces consistent calculations across every dashboard and report. It runs queries directly on cloud data warehouses instead of importing data into a separate layer.
Best For
Data-driven organizations with SQL expertise using Google Cloud or BigQuery that need governed, consistent metrics across all reports and departments. It suits teams where metric inconsistency across teams is a documented problem.
What Looker Does Well
- Enforces strict data standardization and consistent metric definitions across all reports.
- No two dashboards can return different answers to the same question because the logic is centrally defined.
- Google Cloud integration is native and deep.
- Embedded analytics capabilities are well-developed for product and internal tool integration.
What Looker Does Not Do
- Looker requires SQL and LookML expertise to set up and maintain, which means it is not accessible without a technical data team.
- Not suitable for small physical businesses and has no POS integration.
- Annual contracts are required.
- The implementation timeline for a new deployment is measured in weeks, not days.
Pricing: Custom plans Standard, Enterprise, Embedded. Market reports the minimum cost for the Standard plan costs above $60,000.
Sisense: Embedded Analytics for SaaS Companies, Not for Independent Small Businesses
What Sisense Is
Sisense is an enterprise BI and analytics platform built primarily for embedding analytics into customer-facing SaaS applications. It gives software companies the ability to deliver white-labeled dashboards inside their own products, with extensive APIs and customization options. It now operates under Perion ownership.
Best For
Mid-to-large enterprises and SaaS companies that want to embed BI dashboards inside their own products for external customers. If you are building a software product that needs analytics for end users, Sisense is built for that use case specifically.
What Sisense Does Well
- Handles complex, high-volume datasets and concurrent user loads well.
- Embedded analytics capabilities are developer-friendly, with APIs that allow deep product customization.
- AI-powered Sisense Intelligence features add automated insight generation inside embedded environments.
What Sisense Does Not Do
- Sisense is not suitable for an independent small business owner reporting on their own operations.
- The starting cost of approximately $21,000 per year rules it out for virtually all small businesses.
- Implementation is complex, the learning curve is steep, and the platform has no physical business data integration.
Pricing: Custom pricing for self-serve and enterprise plans, industry insights report minimum $25,000/year.
Key Factors to Consider When Choosing a Tableau Alternative
These are the key factors that actually determine whether a tool works for a small business, rather than just looking good in a demo.
- Technical requirement: The most important factor for a small business without a data team. Tools like Tableau, Qlik Sense, and Looker require technical setup and ongoing maintenance. Tools like Zoho Analytics, Looker Studio, and DashboardFox require less. Miivo requires none, the team handles everything.
- Pricing model: Per-user pricing (Tableau, Power BI, Qlik) scales with headcount. Flat monthly pricing (DashboardFox, Metabase) is more predictable for teams with mixed usage patterns. Consumption-based pricing (Domo) is the hardest to forecast. All-inclusive service pricing (Miivo) includes setup, interpretation, and ongoing support in one number.
- Your existing tech ecosystem: Power BI fits Microsoft 365 organizations. Looker Studio fits Google Workspace. Zoho Analytics fits Zoho CRM users. Looker fits Google Cloud and BigQuery. Choosing a tool already integrated into your stack reduces the time and cost to get it working.
- Physical business data: If your revenue comes from a physical location, such as a restaurant, salon, gym, or retail store, your most important data lives in your POS system and booking platform, not in a spreadsheet. Miivo connects to these natively, while every other tool on this list requires you to export data manually or pay for a third-party connector.
- Total cost of ownership: License cost is only one line. Training, data preparation, connector fees, and engineering time are the others. Tableau’s official instructor-led courses run $1,200 to $2,000 per person. Teams using Tableau typically spend 60 to 80 percent of their time preparing data before a dashboard can be built. Factor those costs into any comparison before committing.
- Scalability: Some tools, like Zoho Analytics, perform well up to 10 million rows and then slow down. Others, like Looker and Qlik Sense, are built to scale to enterprise workloads. Match the tool’s ceiling to your realistic data volume over the next two to three years, not just today.
Which Tableau Alternative Is Right for Your Business?
The right tool depends on your situation, see the common ones with a clear recommendation for each below.
- You run a physical business and need financial and operational data connected automatically without a data engineer.
Miivo is the only option on this list built for this. It connects POS, accounting, and review data automatically and includes a dedicated human team. None of the other nine alternatives connect to POS systems or booking platforms natively.
- You or your team already use Microsoft 365 and want a lower-cost Tableau alternative with a familiar interface.
Power BI at $14/user/month is the most practical starting point. Deep Microsoft integration reduces setup friction. Be aware of the DAX learning curve for building custom calculations.
- You want a free reporting tool and already use Google Analytics or Google Workspace.
Looker Studio is free and connects natively to Google’s ecosystem. If your data is already in Google’s tools, it is the fastest path to a working dashboard.
- You want a simple self-serve tool without technical complexity or high licensing costs.
Zoho Analytics at $30 to $60/month or Metabase at $100/month (Cloud Starter) are the most accessible paid options. Metabase is slightly simpler to use for non-technical teams. Zoho has a wider integration library.
- Your team has analysts who need to explore complex, multi-source data with more depth than Tableau allows.
Qlik Sense’s associative engine surfaces relationships between datasets that a linear query misses. It is better suited to teams who need exploratory analysis across many connected data sources.
- You need BI embedded in a SaaS product you are building.
Sisense is built specifically for this, as it is expensive and not suitable for a business owner reporting on their own operations, but if you are building a software product that needs embedded analytics for external customers, it is the strongest option on this list for that specific use case.
Running a Physical Business and Looking for a Tableau Alternative?
Book a 15-minute call. We will connect to your data and show you what your financial and operational picture looks like inside Miivo.
*No credit card. No commitment. Live in 5 days.