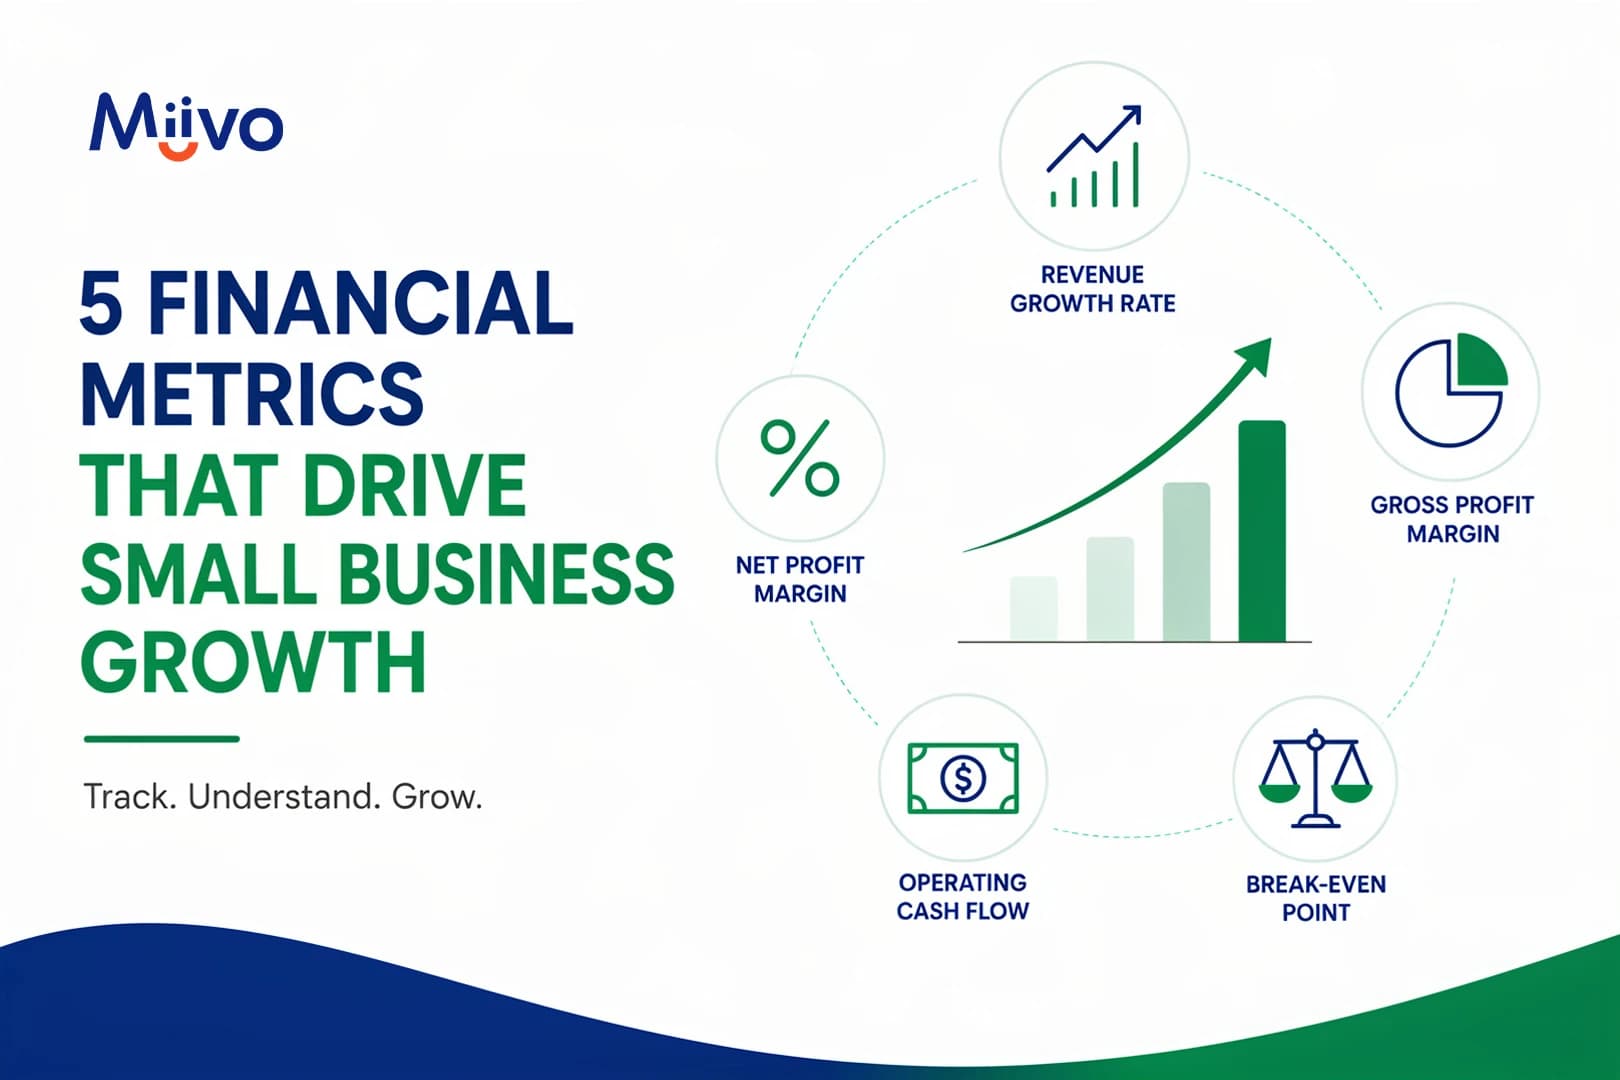
The five financial metrics that matter most for small business growth are revenue growth rate, gross profit margin, net profit margin, operating cash flow, and break-even point. This page covers what each one measures, how often to check it, how to read a metric as a trend rather than a snapshot, the additional metrics a physical business needs, and the tracking mistakes that turn a reporting habit into wasted time.
Most small business owners track revenue. Some track profit. Very few track the specific metrics that signal whether the business is growing, stalling, or heading toward trouble. The difference between a business that grows and one that stays flat is usually not effort or luck. It is whether the owner is watching the right numbers, reading them correctly, and acting before the window closes.
What Are Financial Metrics and Why Should Small Business Owners Track Them?
Financial metrics are the specific numbers that measure the financial health and trajectory of a business. Revenue, profit margin, and cash flow are the most common. Tracking them is not the same as understanding them.
A financial metric becomes useful only when it is compared against something, such as last month, last year, or a target, and when the comparison leads to a question or an action. The same rule governs a KPI for a small business, which means nothing until it is paired with a goal. Without that context it is a number on a screen. The purpose of tracking metrics is not reporting. It is deciding.
Which Financial Metrics Should Every Small Business Track for Growth?
The financial metrics that every small business should track for growth are revenue growth rate, gross profit margin, net profit margin, operating cash flow, and break-even point. Not every financial metric matters equally. The following five deserve attention first because they connect directly to growth decisions.
1. Revenue Growth Rate
Revenue growth rate is the percentage change in revenue from one period to the next. A business can feel busy without actually growing, and revenue growth rate separates activity from progress. Track it monthly and compare year over year to account for seasonal patterns.
2. Gross Profit Margin
Gross profit margin is revenue minus cost of goods sold, divided by revenue. It shows how efficiently the business turns revenue into profit before overheads. If gross margin is shrinking while revenue grows, the business is scaling a problem. For a restaurant, this metric is closely tied to food cost percentage.
3. Net Profit Margin
Net profit margin is what remains after every cost, tax, and expense is paid, expressed as a percentage of revenue. This is the number that tells you whether the business is actually making money. A business with strong revenue and weak net margins has a cost problem or a pricing problem.
The general benchmark is that 5% is low, 10% is healthy, and 20% or above is strong, and net margin is one of the five key financial metrics every business owner must track. Industry context matters more than the general figure. Independent restaurants typically run 3% to 5%, while salons commonly clear 10%. A 6% net margin is respectable in grocery retail and a warning sign in software.
4. Operating Cash Flow
Operating cash flow is the cash generated from normal business operations. A business can be profitable on paper and still run out of cash if receivables are slow or inventory ties up capital. Cash flow is what pays rent, payroll, and suppliers. Profit is an accounting concept. Cash is what the business survives on.
The risk here is documented by a widely cited U.S. Bank study, repeated by SCORE and the Small Business Administration, which found that poor cash flow management contributed to 82% of small business failures. This makes small business cash flow failure the most documented reason a profitable-looking business stops trading. The figure is best read as cash flow being implicated in most failures rather than as the single cause of them.
5. Break-even Point
The break-even point is the revenue needed to cover all fixed and variable costs. It sets the baseline below which the business loses money. Knowing it makes pricing, staffing, and expansion decisions concrete.
| Metric | What It Tells You | How Often to Check |
| Revenue growth rate | Whether the business is expanding | Monthly, compared year over year |
| Gross profit margin | Efficiency of revenue converting to profit | Monthly |
| Net profit margin | Whether the business is actually making money | Monthly |
| Operating cash flow | Whether operations generate enough cash | Weekly |
| Break-even point | The minimum revenue to cover costs | Quarterly |
How Do You Read Financial Metrics to Spot Growth or Trouble?
A single month of financial data is a snapshot and tells you almost nothing on its own. Metrics become useful when tracked over time and compared against a target or a previous period.
A gross margin of 58% is neither good nor bad until you know it was 64% three months ago. Direction matters more than the absolute number. A metric trending the wrong way for two consecutive months is a signal. Three months is a pattern that needs action.
Which Financial Metrics Do Physical Businesses Need Beyond the Standard List?
The five metrics above apply to every business. A physical business such as a restaurant, salon, or gym needs additional metrics that connect the financial numbers to operational reality. These are the metrics that explain why the standard financial metrics are moving the way they are.
● Revenue per cover, per appointment, or per visit: Shows the average value of each customer interaction. If total revenue is growing but revenue per cover is falling, the business is getting busier without getting more profitable.
● Labor cost as a percentage of revenue: Shows whether staffing levels match the revenue they generate. This should stay within a target range. A spike means either overstaffing or a revenue shortfall.
● Customer acquisition cost: Shows what it costs to bring in a new customer through marketing, promotions, or discounts. Growth that costs more per customer than each customer is worth is not sustainable growth.
● Average transaction value: Shows the average amount each customer spends per visit. Tracking it reveals whether upselling, menu changes, or pricing adjustments are working.
What Mistakes Do Small Businesses Make When Tracking Financial Metrics?
Most small businesses make the same few mistakes.
● Tracking too many metrics at once: Tracking 15 metrics and acting on none is worse than tracking 5 and acting on each. Start with the five that connect to growth decisions and expand only when those are under control.
● Looking at metrics in isolation: Revenue growth means nothing if margins are shrinking. Cash flow means nothing if receivables are growing faster. A change in one almost always has a cause in another.
● Checking metrics only at month-end or quarter-end: A metric that has been trending the wrong way for 30 days has already cost the business money. The earlier a drift is spotted, the smaller the correction needed. Review operational metrics weekly and financial metrics monthly.
● Treating metrics as report cards instead of signals: The point of tracking is not to grade the business. It is to trigger questions and actions. A declining metric should lead to an investigation, not a meeting about why things are down.
How Do Physical Businesses Track Financial Metrics Across Multiple Systems?
The practical barrier for most physical businesses is that financial data lives in the accounting software, operational data lives in the point-of-sale and booking systems, and customer data lives on Google and social platforms. Pulling these into a single view of which metrics are moving and why requires either hours of manual spreadsheet work each week or a tool that does it automatically.
Miivo’s business financial intelligence dashboard connects financial data from accounting, operational data from the point-of-sale, and customer data from review platforms, surfacing which metrics are on track and which need attention without the owner assembling the picture by hand.
How Do You Set Up Budget vs Actual Tracking for These Metrics?
Once you know which metrics to track, the next step is setting targets and comparing actual performance against them each month. Budget vs actual tracking is a straightforward variance calculation, and the discipline is in matching budget categories to accounting categories exactly.
What Does a Business Dashboard Show for Financial Metric Tracking?
A business dashboard brings the five metrics into one screen that updates on a schedule, so the weekly review starts with the numbers already gathered rather than an hour of assembly.
Frequently Asked Questions
What are the most important financial metrics for a small business?
Revenue growth rate, gross profit margin, net profit margin, operating cash flow, and break-even point. These five cover whether the business is growing, whether it keeps enough of what it earns, whether it can pay its bills, and what it must earn to avoid a loss.
What is a good net profit margin for a small business?
The general benchmark is that 5% is low, 10% is healthy, and 20% or above is strong. Industry context matters more than the general figure. Independent restaurants typically run 3% to 5% and salons commonly clear 10%, so compare against your own sector rather than a cross-industry average.
How often should a small business review its financial metrics?
Operating cash flow is best reviewed weekly. Revenue growth, gross margin, and net margin are monthly metrics, reviewed once the previous month is reconciled. The break-even point changes slowly and needs a quarterly review unless costs or pricing shift materially.
Why is my business profitable but short of cash?
Profit is earned over a period, and cash is what is in the account today. The gap comes from customers paying later than suppliers are paid, money tied up in stock, or loan repayments that reduce the balance without appearing as a cost on the profit and loss statement. Tracking operating cash flow alongside net margin is what separates the two.
Can a small business track financial metrics without an accountant?
Yes, every metric on this list can be calculated from a profit and loss statement and a bank balance. The barrier is rarely the calculation, it is keeping the figures current every month once the process becomes manual.
Book a Consultation With Miivo
Five metrics is a short list. Keeping them current across accounting, the point-of-sale, and everything else is what turns a short list into an hour of spreadsheet work every week. Miivo connects the tools you already use, keeps all metrics live, and flags the one that has moved. A dedicated account manager reviews them with you weekly.
Connect the tools you already use. Go live within five days.
[Book a call] [Start for free]
*No credit card required