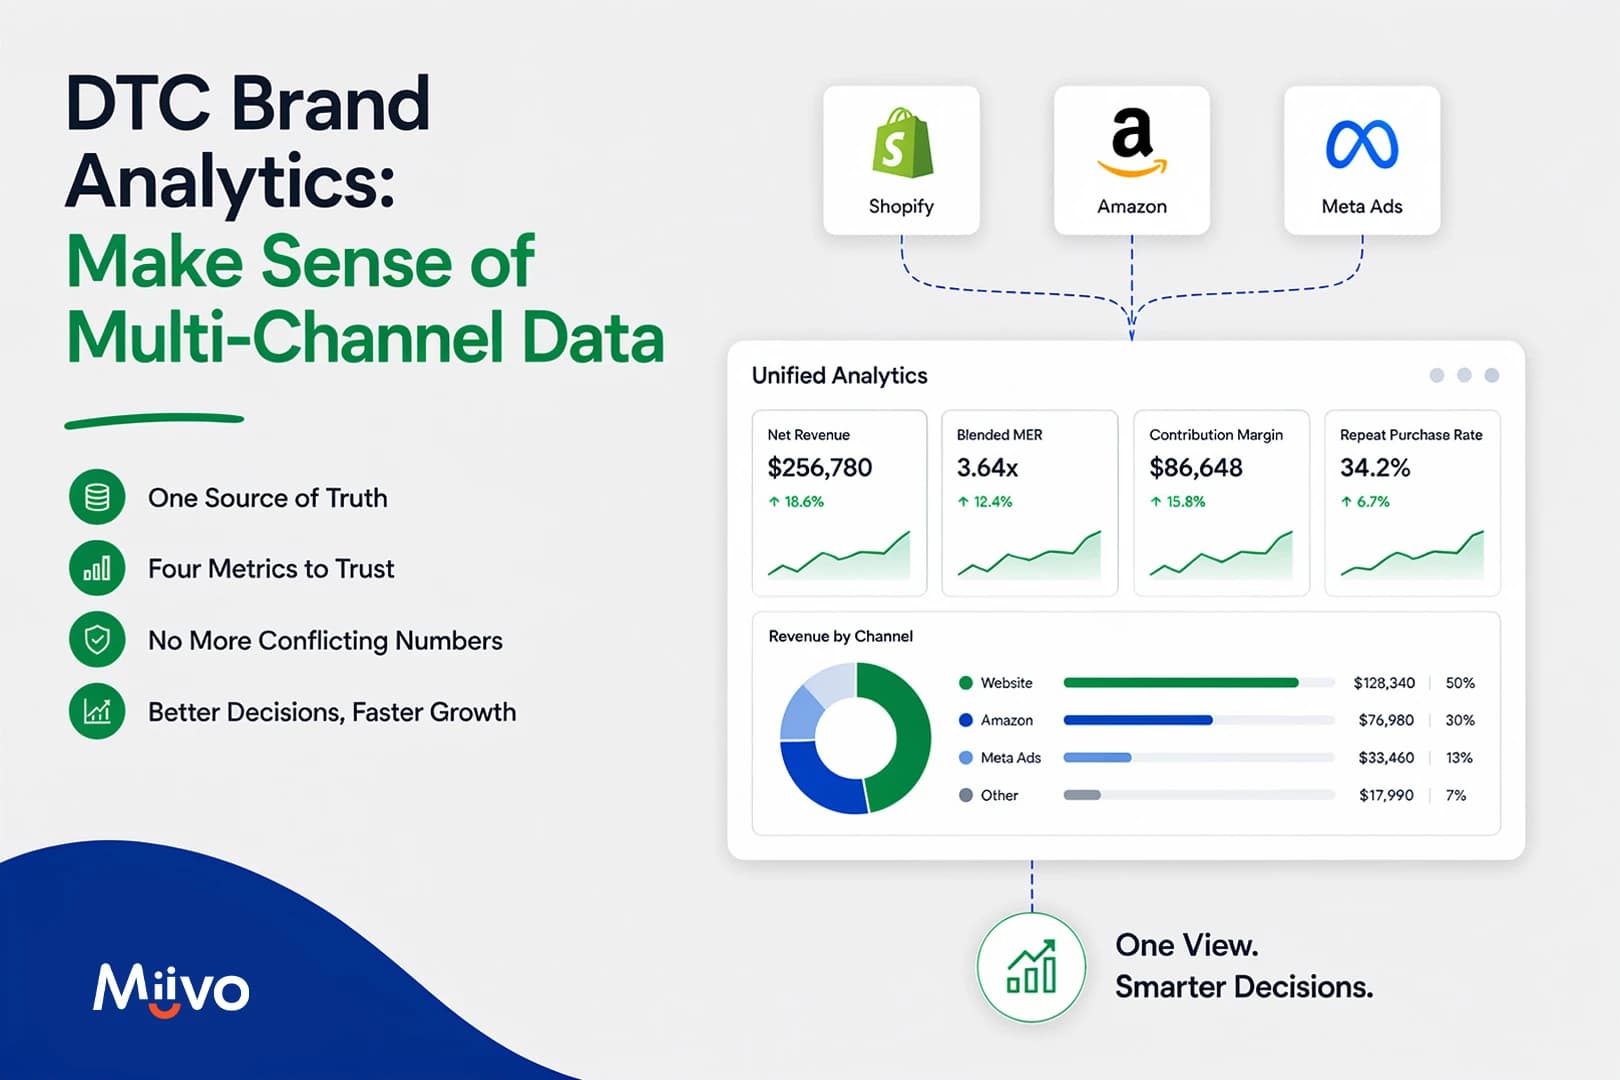
Direct-to-consumer brands selling across a website, a marketplace, and ad platforms see a different revenue number from every system, because each system is answering a different question. This page explains why multi-channel data disagrees, which four metrics to trust instead, how to reconcile every channel into one set of numbers, how much disagreement is normal, and how to run a weekly review that turns those numbers into decisions.
Why Does Your Multi-Channel Data Disagree with Itself?
The following four structural reasons explain almost every mismatch between channel reports, and none of them mean a system is malfunctioning.
- Attribution window overlap: Every ad platform claims full credit for a sale inside its own attribution window, blind to what other platforms also claimed. A single order can be counted in full by two or three platforms at once.
- Different default windows: Meta, Google, and TikTok each measure conversion windows differently by default, so the same week looks different in every dashboard.
- Settlement lag against real-time reporting: Marketplaces report on a settlement cycle, net of referral and fulfillment fees, typically with a lag of about two weeks. A website reports gross sales in near real time. The result is two revenue figures for the same period that cannot be compared directly.
- Timezone and currency shifts: Orders move between days depending on which timezone each system uses, and currency conversion adds another layer of drift.
The numbers are not wrong. Each one answers a different question, and the job is deciding which question matters for the decision at hand.
Which Numbers Should a DTC Brand Actually Trust?
The fix for conflicting channel reports is not a better attribution model but a small set of numbers that cannot be double-counted, because they are measured at the business level, not the platform level.
| Metric | What It Answers | Where It Comes From | Why It Cannot Be Double-Counted |
| Net revenue by channel | What actually landed after fees, returns, and discounts | Your accounting system or store backend | Reconciles to the bank; no platform can claim it |
| Blended MER and CAC | How efficiently total spend converts to revenue and customers | Total spend divided by totals across all channels | Uses business-level totals that no platform can inflate |
| Contribution margin by channel | What each channel leaves after all costs | Net revenue minus COGS, fees, and ad spend | Platform revenue claims are excluded completel |
| Repeat purchase rate by acquisition channel | Whether a channel produces customers who return | Order history joined to first-touch channel | Counted once per customer cohort, not per platform |
- Start with Net Revenue by Channel, Not Platform-Reported Revenue
Net revenue is what actually landed after discounts, returns, marketplace referral and fulfillment fees, and payment processing, split by the channel that made the sale.
Two numbers operators commonly quote instead give a misleading picture. Gross revenue reflects every channel equally because no costs come off. Platform-reported revenue is an ad platform’s claim, not a record of money received.
A marketplace and a website with identical gross revenue can differ substantially in net, because marketplace fees are deducted before the deposit arrives. Net revenue by channel is the only revenue line that reconciles to the bank.
- Read Your Ad Spend Blended, Not Platform by Platform
MER (Marketing Efficiency Ratio) is total revenue divided by total advertising spend across every channel. Blended CAC (Customer Acquisition Cost) is total advertising spend divided by all new customers acquired. Because both use totals, no single platform can inflate them by claiming a sale twice.
One calculation is worth knowing, break-even MER equals one divided by your contribution margin. A brand running at 20% contribution margin needs a MER of 5.0 to break even. A brand at 50% needs 2.0.
Per-platform return on ad spend is useful for directional comparison within a single channel and unreliable as a business-level truth.
- Judge Every Channel on Contribution Margin, Not Revenue
Contribution margin is what a channel leaves after cost of goods, fulfillment, shipping, channel fees, and the advertising spent to win the order.
A revenue-ranked channel list misleads because it ignores all of those costs. A marketplace can be the largest channel by revenue and the smallest by contribution once referral and fulfillment fees are removed. A small wholesale line can out-earn both because it carries almost no acquisition cost.
Contribution margin by channel is the number that should decide where the next dollar of spend and inventory goes.
- Track Repeat Purchase Rate by Acquisition Channel
Group customers by the channel that first acquired them, then measure how many bought again within a fixed window, typically 90 or 180 days.
That cohort view reveals something a first-order report cannot: two channels can produce identical acquisition cost while one delivers customers who never return and the other delivers customers who buy three times.
This metric requires nothing more than order history joined to first-touch channel, so it is available to a brand of any size with no additional tooling.
How Much Disagreement Between Platforms Is Normal?
Some gap between platform-reported figures and store records is expected and permanent. Attribution vendors commonly report gaps in the region of 20% to 35% between an ad platform’s claimed conversions and a store’s own last-click record on default windows.
The useful test is simpler than any benchmark. A stable gap is a measurement difference and can be accepted once its size is known. A gap that moves suddenly is a tracking problem worth investigating. Record your own normal gap per platform once, then compare against it each week.
How Do You Reconcile Your Channels into One Set of Numbers?
Reconciliation is a set of decisions, not a piece of software. Buying a tool before making those decisions automates the confusion instead of solving it. Follow these steps in order.
- Agree the definitions: Write down what revenue, an order, and a new customer mean for your business. Most disagreement between systems comes from two platforms using the same word differently.
- Choose one revenue record: Pick the system that reconciles to the bank, usually your store backend or accounting software, and treat every other revenue figure as a report rather than a source of truth.
- Bring spend in as spend only: Pull figures from each ad platform as cost data, never as claimed revenue.
- Set one shared calendar and timezone: Every channel must be cut on the same week and the same timezone, or the comparison is meaningless.
- Rebuild the same figures the same way each period: Consistency matters more than precision.
How Do You Put Wholesale and Retail into DTC Reporting?
Wholesale and retail accounts rarely offer an API, so the data arrives as spreadsheets, EDI files, or performance emails, each partner using its own format and column names. That is why this channel is usually left out of dashboards entirely.
Three practical steps make wholesale manageable.
- Sync every partner’s columns to your own standard definitions once, instead of per report.
- Label sell-in and sell-through clearly and separately, because they are different numbers and conflating them produces misleading totals.
- Accept a slower reporting cadence for this channel rather than excluding it.
Wholesale often carries the highest contribution margin on the channel list, precisely because it carries almost no acquisition cost. Brands running several partners or storefronts hit the same consolidation problem that multi-location business analytics software exists to solve.
What Are the Most Common DTC Analytics Mistakes?
The following five mistakes appear consistently across DTC brands at every stage of analytics.
- Adding up platform-reported revenue across channels and believing the total: Platform return on ad spend and gross revenue flatter performance by ignoring returns, fees, and cost of goods. Use net revenue by channel as the only revenue input.
- Ranking channels on revenue instead of contribution margin: Revenue ranking puts the most expensive channel at the top. Rank by contribution margin and let that decide where the next dollar goes.
- Changing attribution windows or definitions mid-quarter: No trend survives a definition change. Lock definitions at the start of each quarter and change them only at a boundary.
- Leaving wholesale and retail out because the data is awkward: Map partner columns to standard definitions once and accept a slower cadence for those channels.
- Buying an analytics tool before agreeing what the words mean: Run the five-step reconciliation sequence first, then automate it with automated business reporting software once the definitions are locked.
The goal is not one perfect number. The goal is one number everyone in the business argues about in the same way, which is what a business dashboard is for once the definitions are agreed.
Do You Need an Attribution Platform, or Just One Clear Dashboard?
Attribution tooling tries to answer which channel caused a sale. Reporting answers what actually happened across every channel. Most brands need the second before they need the first.
For brands below roughly seven figures in revenue, reliable blended reporting delivers more value than a modeled attribution stack. Buying attribution before definitions only produces a more expensive version of the same disagreement.
Multi-touch attribution, marketing mix modeling, and sequential testing play distinct roles in a measurement stack, and they are worth investing in once ad spend is large enough that a wrong allocation costs more than the tool itself. Miivo functions as the connected reporting layer rather than an attribution product. The AI Business Dashboard connects the tools brands already use and keeps net revenue, cost, and margin current per channel in one view, with a dedicated account manager reviewing those numbers with the brand every week.
Frequently Asked Questions About DTC Multi-Channel Analytics
Why do my Shopify and Meta numbers not match?
Shopify records orders it can trace to a last click. Meta claims every sale inside its own attribution window, including view-through conversions that Shopify does not record, so a stable gap is normal. A sudden change in the size of that gap is a tracking problem that needs to be investigated.
What is MER, and is it better than ROAS?
MER (Marketing Efficiency Ratio) is total revenue divided by total ad spend across all channels. Per-platform ROAS (Return On Ad Spend) is better for directional comparison within a single channel. MER is the better business-level number because no platform can inflate it by claiming a sale twice. Break-even MER equals one divided by your contribution margin.
What is a single source of truth for a DTC brand?
A single source of truth is one agreed place where each figure is defined and recorded. For revenue, it is usually the system that reconciles to the bank, and every other platform is treated as a report, not a source. The definitions of revenue, an order, and a new customer must be written down and held constant across all systems.
How many metrics should a DTC dashboard show?
A DTC dashboard should show fewer metrics than most brands run. Four business-level metrics plus a per-channel breakdown cover weekly decisions. If a number would not change what your brand does this week, move it to the quarterly review.
How do you calculate contribution margin by channel?
Start with net revenue for that channel, then subtract cost of goods, fulfillment and shipping, channel and payment fees, and the advertising spent to acquire those orders. What remains is contribution margin, and it is the figure that should decide where the next dollar of spend and inventory goes.
Book a Consultation With Miivo
Start for free or book a 15-minute free call to understand you DTC brand analytics with Miivo.
Connect the tools you already use. Go live within five days.
[Book a call] [Start for free]
*No credit card required