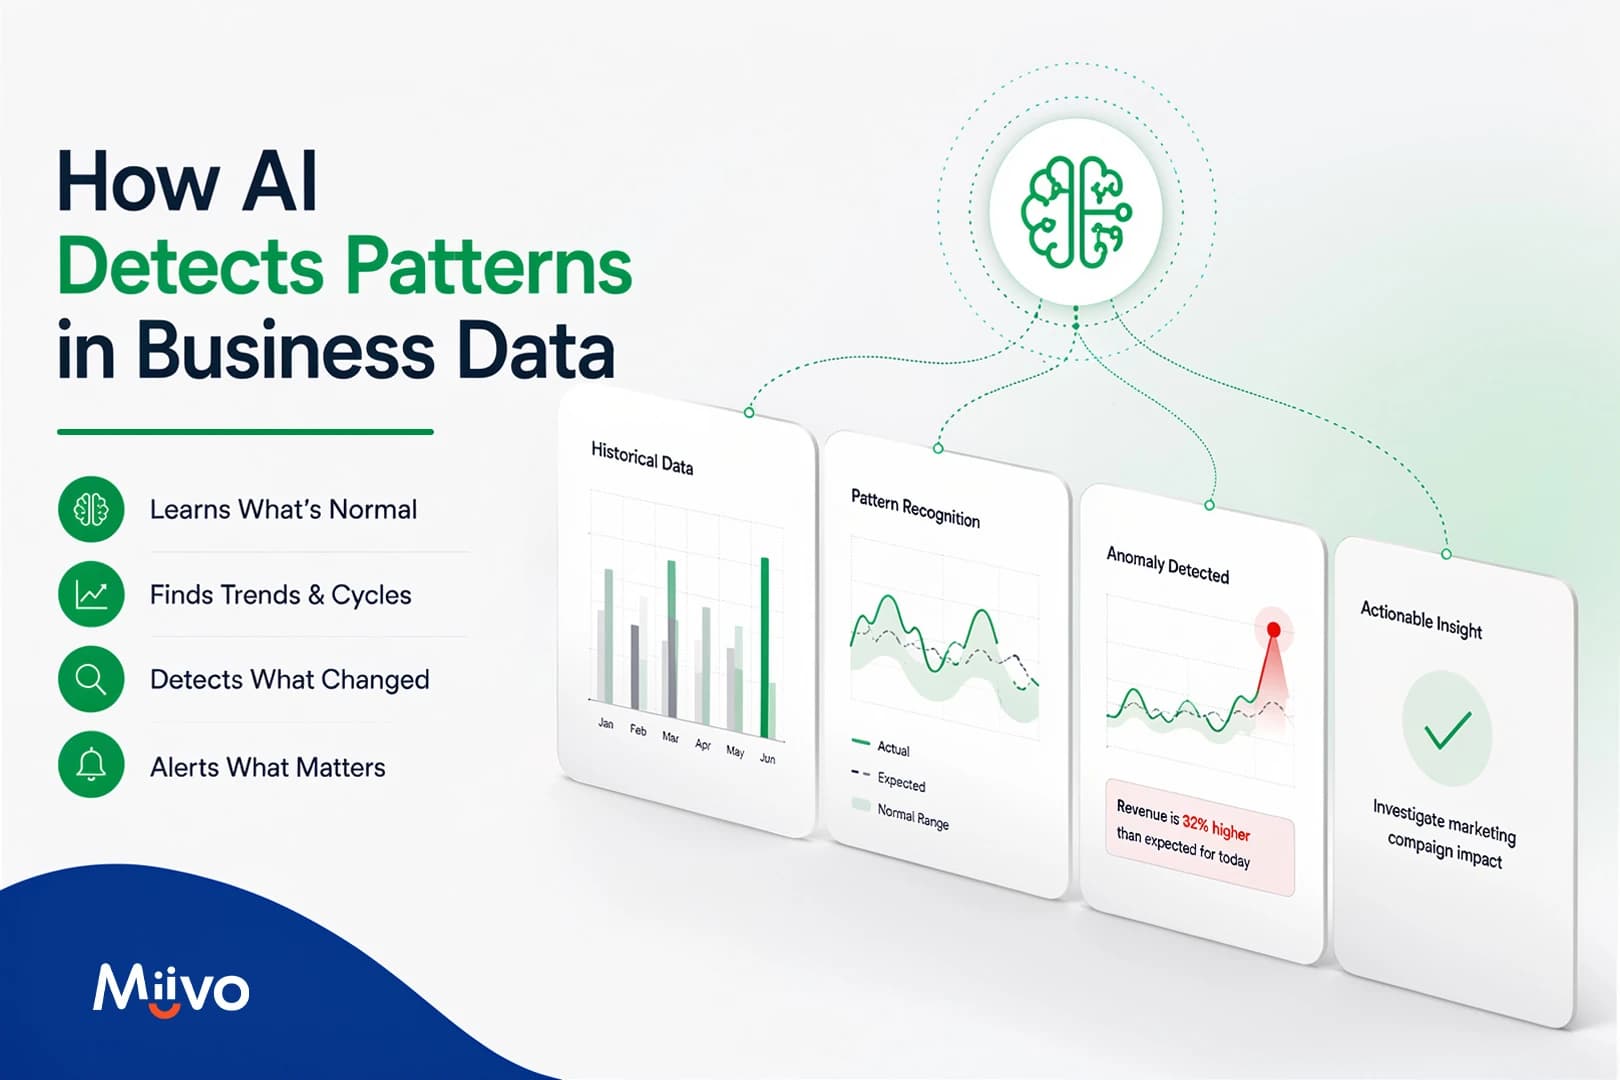
AI detects patterns by learning what normal looks like for your business from your own historical data, then watching every number against that baseline and flagging what breaks the pattern. This page covers the five types of pattern that matter, the four mechanisms behind the detection, what the technology gets wrong, and what to do when something is flagged.
Your business data tells a story every day, and nobody has time to read it. Pattern detection changes that by learning your normal from your own history, then watching every number against that baseline continuously. The point is not a better dashboard. The point is not having to go and look.
What Counts as a Pattern in Business Data?
Most business owners use “pattern” to mean “something spiked.” The operational signals sitting in your data are more varied than that. Five types matter.
● Anomaly: One reading well outside the usual range. A supplier invoice triple its normal size is a clean example.
● Trend: A slow, steady drift in one direction that no single day reveals. Margin slipping a fraction each week adds up to a serious problem by the time it appears on a monthly report.
● Seasonal cycle: A repeating shape in the data. Every Monday being quieter than other days is a cycle, not a problem.
● Correlation: Two things moving together. Delivery times rising alongside one-star reviews suggests a connection worth investigating.
● Segment difference: One group behaving unlike the rest. One location, product, or channel drifting away from the others is a segment difference, and it is the pattern operational intelligence exists to surface.
Trends and segment differences are the two patterns people almost never catch unaided. Neither is visible on any single day’s report, and both tend to surface only after the damage is done.
How Does AI Actually Find These Patterns?
The mechanism rests on four ideas: the software learns your normal, separates the signal from the season, checks every combination, and compares actual results against predicted ones. Machine learning sits underneath all four, and no algorithm name matters here. What matters is what each step does for your business.
| Step | What the Software Does | What It Catches | What It Needs from You |
| Learn your normal | Reads your history and builds an expected range for each metric | Readings outside your specific normal band | Several weeks of consistent historical data |
| Separate signal from season | Pulls apart the long-term direction, the repeating cycle, and what is left over | The genuine surprise, stripped of expected seasonal movement | Enough history to see the cycles relevant to your business |
| Check every combination | Scans every location, product, and channel slice, every day | Patterns nobody thought to look for | Data connected across your systems in one place |
| Compare actual against predicted | Treats the gap between predicted and actual as the signal | Problems flagged while the period is still open | A baseline reliable enough to generate useful forecasts |
First It Learns Your Normal, Before It Looks for Anything Unusual
Baselining is the foundation of the whole mechanism. The software reads your historical data and works out the usual range for each number, which is not just an average but how much that number normally moves.
A cafe taking between $1,800 and $2,400 on a Tuesday has a normal that is a band, not a line. A Tuesday result of $2,500 is interesting only because the band says so. A result of $2,200 is not worth a mention, even though it looks different from the average.
This is why a learned baseline beats a threshold you type in yourself. The band differs for every metric, every day of the week, and every location, and it moves as the business changes. A threshold set last January does not know the business is 20% larger now.
Building a reliable baseline needs several weeks of history, and anything with a yearly seasonal cycle needs a full year. The system does not work from day one, and no honest tool will tell you otherwise.
Then It Separates the Trend, the Season, and the Surprise
Any business number is three things stacked on top of each other: a long-term direction, a repeating cycle, and whatever is left over when the first two are accounted for. The software pulls them apart and watches each separately.
One worked example makes this concrete. Takings are down 12% this week. The seasonal component explains 10 of those percentage points, because the same dip happens every year at this time. The part that is genuinely new is the remaining 2 points.
This is why good detection does not alert every December. A fixed percentage rule always does, because it has no way of knowing December is expected to be quiet.
It Checks Every Combination, Not Just the Ones You Thought to Check
The honest reason software beats a person at pattern detection has nothing to do with intelligence. It is scale. A business with six locations, forty products, and five channels has thousands of possible slices of data, and a person can realistically look at the handful they already suspect.
Software checks all of them, every day, without getting bored or having a hunch. The patterns found this way are usually the ones nobody was looking for: a single product losing margin at only one location, or a channel that drives orders but produces disproportionate returns.
One caution belongs here. Checking thousands of combinations also means finding coincidences, and two numbers lining up by chance is not a real pattern.
And It Compares What Happened Against What It Expected to Happen
The forecasting side of detection is the same mechanism viewed from a different angle. The software predicts what each number should be, then treats the gap between the prediction and the actual result as the signal.
If the model expected 300 orders and 240 arrived, the interesting number is not 240. It is the 60 that did not show up, and that gap can be flagged while the period is still open rather than confirmed after the month closes. Building the prediction in the first place is the subject of how to forecast business growth.
Why “Without You Having to Look” Is the Whole Point
A dashboard is a tool you open and interpret, which means it catches problems on your schedule rather than on the problem’s schedule. Detection with alerting works the other way. An AI early warning system watches continuously and tells you only when something has actually changed.
The cost of the dashboard model is not the time spent looking. It is the two weeks between a problem starting and somebody noticing. Two weeks of margin slipping. Two weeks of one location falling behind.
Dashboards remain the right tool for a question you already have. Looking up last month’s revenue by channel is a business dashboard job. Finding problems before they cost you is an alerting job. The distinction is which one comes to you.
What Does AI Get Wrong When It Looks for Patterns?
Every tool selling this capability writes about what it can do. Few write about what it gets wrong. Three limits are worth knowing.
It finds coincidences. Checking thousands of combinations guarantees some will line up by chance. A well-built system ranks findings by financial impact rather than showing everything it noticed. If a flagged pattern is worth $80 a month, it should rank well below one worth $8,000. A system that does not rank is generating noise, not insight.
It finds the pattern, not the reason. Software can tell you that returns rose at one location and that a supplier changed the same week. It cannot tell you which caused the other. Treating a correlation as a cause is the most expensive mistake available here.
It inherits your data quality. A register miskeyed for two weeks becomes part of normal, and the software stops flagging it because the baseline absorbs it. The data going in determines the quality of what comes out.
Detection tells you where to look. A person still decides what it means and what to do.
What Should You Do When a Pattern Gets Flagged?
Getting an alert is the beginning, not the result. A short repeatable routine handles most flagged patterns without creating noise.
● Size it. A flagged change worth $80 a month does not deserve a meeting. One worth $8,000 does. Check the financial impact before forming a theory.
● Explain it. Look for the boring explanation first. A public holiday. A promotion that ran last week. A system outage. Most flags have a dull answer.
● Confirm it. Decide whether this is a one-off or the start of something, which usually means waiting for a second reading before acting. One data point is not a trend.
● Own it. If the flag survives all three, give it one owner and one action with a date. Building the routine into a weekly data review makes it faster each time, and an alert without an owner is an alert nobody acts on.
The value of detection is not the alert. It is the decision that follows. An alert nobody acts on is worse than no alert, because it trains everyone to ignore the next one.
What Data Does AI Need Before It Can Spot Anything?
Three requirements determine whether a pattern detection system can produce reliable results.
● Enough history. Several weeks supports a weekly pattern. A full seasonal cycle needs a year of data. Less than that and the system flags normal variation as problems.
● Consistency. The same thing recorded the same way each time. A product renamed halfway through the year reads as two separate products, and inconsistent naming breaks the baseline.
● Connection. A pattern spanning the point-of-sale system and the accounting software cannot be seen by either system alone. Connecting the systems you already use is almost always the real work, because most businesses already have the data and it is simply not in one place.
How Is This Different from Just Setting Up Alerts Yourself?
A rule you write is a fixed line, and it does not know that Sundays are quiet, that January is slow, or that the business is bigger than it was last year.
A fixed line set tight enough to catch real problems fires constantly on normal variation. A line set loose enough to stay quiet misses everything gradual. A learned baseline solves both, because it moves with the business.
Simple threshold rules remain the right answer for genuine hard limits, such as stock hitting zero or a payment failing. Everything else benefits from a baseline that adapts, which is the difference between a spreadsheet alert and automated business reporting software that updates without you.
Does a Small Business Have Enough Data for This to Work?
Pattern detection needs history, not volume. A business doing thirty orders a day for a full year gives a model far more to work with than one doing thousands of orders for two weeks.
Daily and weekly patterns are usually strong in small businesses, which makes them easier to model rather than harder. The system identifies your Monday, your quiet January, and your seasonal peak without needing large quantities of data.
One honest limit applies. A very new business, or a metric that only moves a few times a month, will not produce a reliable baseline, and no software can invent one. The prerequisite is time in operation, not transaction count.
Frequently Asked Questions About AI and Business Data Patterns
How does AI know what is normal for my business?
The software reads your own historical data and works out the usual range for each number, by day of the week and by location. Normal is a band rather than a single figure, and the band moves as the business changes.
How much history does AI need to detect patterns?
Enough to see the cycles that matter to your business. Several weeks of data supports a weekly pattern. Anything with a yearly seasonal cycle needs a full year of history. Less than that and the system flags expected seasonal changes as problems.
Can AI tell me why something changed?
No. The software tells you what changed, how large the change is, and what else changed at the same time. Working out which one caused the other is still a person’s job, and treating a correlation as a cause is the expensive mistake here.
Will it just send me alerts all day?
No, if it is configured properly. A well-configured system ranks what it finds by financial impact and surfaces only the few findings worth acting on. If everything is being flagged, the baseline is wrong, not the business.
What is the difference between pattern detection and a dashboard?
A dashboard answers a question you already have, on your schedule. Pattern detection watches continuously and tells you when something has changed, on the problem’s schedule. Most businesses need both, and the difference that matters is which one requires you to remember to look.
Book a Consultation With Miivo
Detection finds the signal. Deciding what it means takes someone who knows the business. Miivo connects the tools you already use, surfaces what changed as AI Warning Signals and Opportunity Cards, and a dedicated account manager reviews them with you every week to help you act on the ones that matter.
Connect the tools you already use. Go live within five days.
[Book a call] [Start for free]
*No credit card required